Read your visibility dashboard
Share of voice, position, citations, sentiment. Four numbers that get confused constantly — here is what each one actually tells you.
Transcript
The full voiceover, so you can read it, search it or skim it instead of watching.
In this session we're going to look into Web, Social and Technical Visibility.
Let's start with Web Visibility — your Search Console and your Analytics in one place. At the top: clicks, impressions, click-through rate and average position.
Underneath, the sessions by acquisition channel. An interesting one to look at is AI Assistant. It adds up every session that came in from a language model.
The card next to it opens that bucket up — the same traffic, by what it did rather than where it came from. It is different from AI Visibility, because AI Visibility tracks the four engines scaile puts questions to. This one counts whatever sent you a visitor.
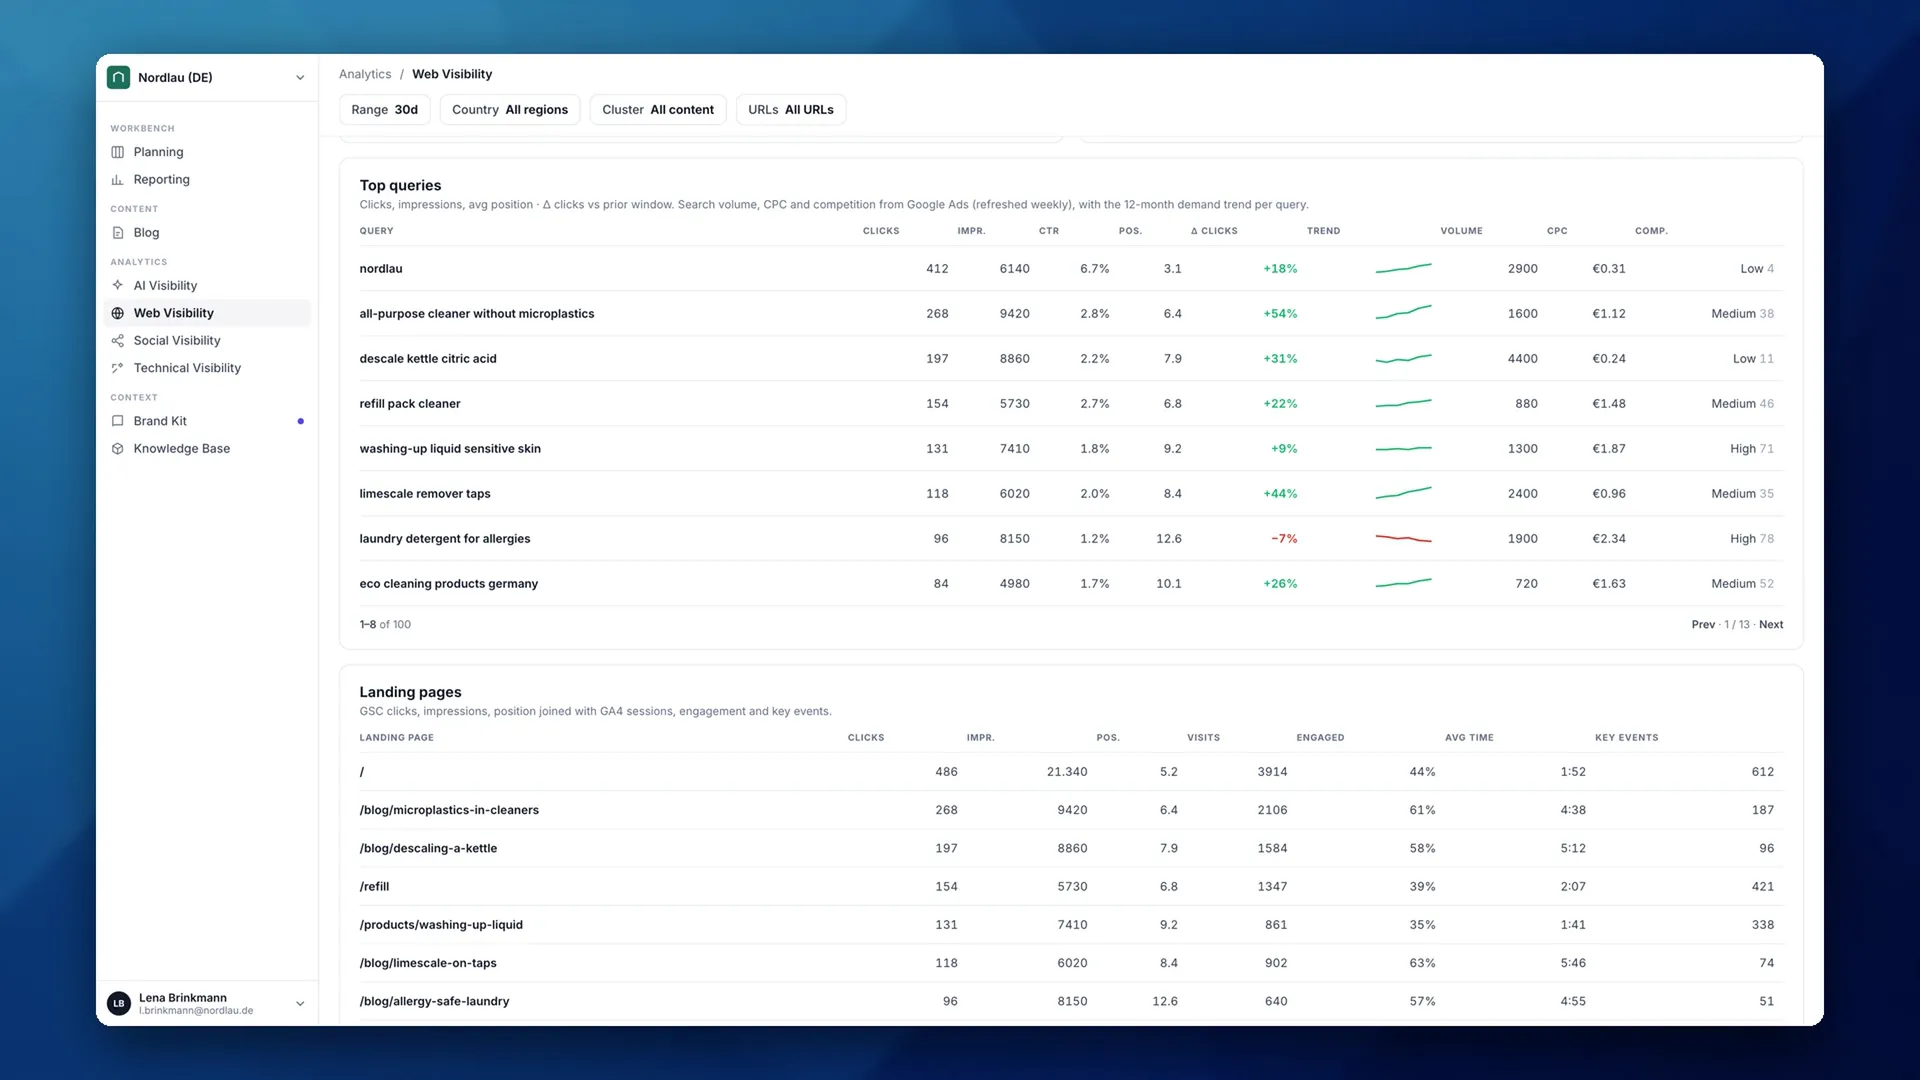
Then Top queries — the only table that puts your performance and the actual demand in one row. Left, what you're getting: clicks, impressions, position. Right, the size of the prize: volume, cost per click, competition.
Now Social Visibility, which counts what people say about you in public. The funnel sorts each mention by where that person had got to. Three numbers on the right: mentions, average sentiment nought to a hundred, and share of voice against your competitors.
Technical Visibility crawls your site and scores it. Open the score. Every site starts at a hundred, and each problem takes points off by priority.
Below it, ten categories — each one written as a question. If an engine can't fetch your page, nothing you publish gets read. The other three screens depend on this one.
Put these together with AI Visibility from the last lesson and the four make one sentence. Technical, whether you can be read. AI Visibility, whether the models name you. Web, whether anyone turned up. Social, whether anyone repeated it.
Next, we will turn all this data into a content plan.